Eigen Spectra Plot Visualization
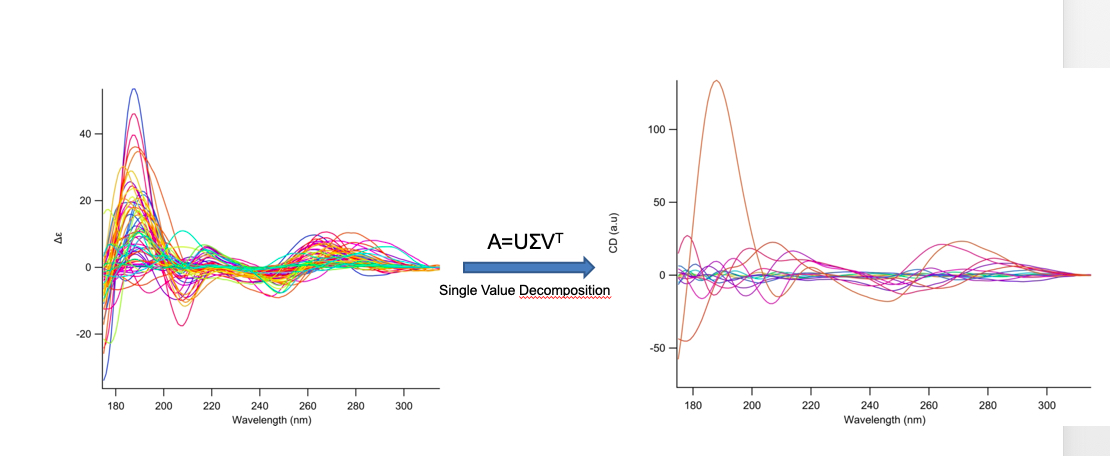
In terms of information content obtainable from the NACDDB, we have chosen the 63 SRCD spectra representing a mix of characteristic polynucleotide sequences and folds. From these 63 spectra, a decomposition into distinct spectra using single value decomposition (SVD) revealed 15 relevant spectra. The statistical correlation of the distinct spectra (Eigenspectra) was r=0.04 with a standard error of sr=0.08. Based on the very low correlation of the eigenspectra we assume a nonlinear correlation. Surely this is not excessive but leads us to the hypothesis that it will be possible to identify characteristic polynucleotide folding patterns similar to the secondary structure elements found in proteins. Indeed, 8 eigenspectra contribute to the deconvolution of protein CD spectra according to eight secondary structures. It is evident that the electronic transitions within a polynucleotide (e.g. between base-paired nucleotides) span a much larger distance than observed in the peptide bond, ±17.5Å versus 2.25Å respectively. The eigenspectra are included in NACDDB as special entries (eigenspectra), which can be queried separately and compared pairwise with experimental spectra.