Hints for users: New and updated features in MODOMICS 2023 RELEASE
This page describes the new and updated MODOMICS features for the 2023 release. The updates are explained section by section to guide the user in the exploration of MODOMICS. We proceed by following the order of the sections from top to bottom as shown in the MODOMICS side navigation bar. Numbered boxes in the pictures are hereafter referred to as BOX #, where # indicates the number inside the frame.
Index
UNNATURAL MODIFICATIONS
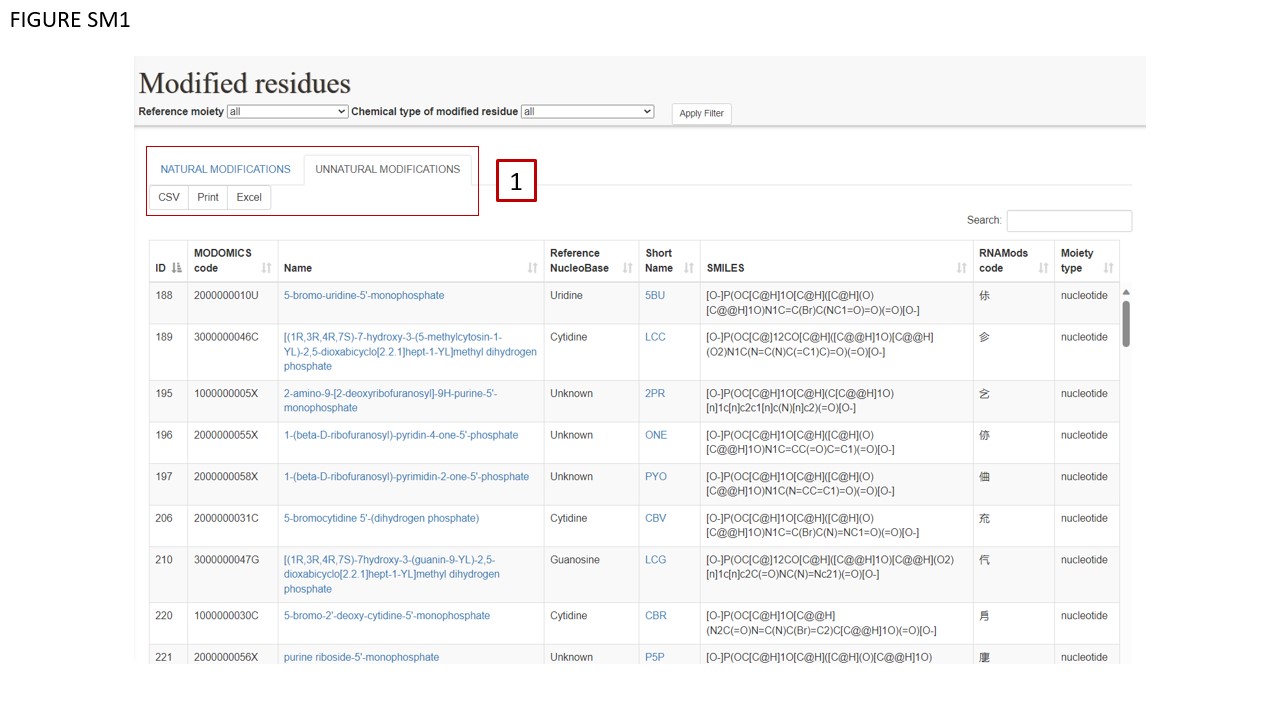
MODOMICS has been updated to include a catalogue of modified nucleotides not observed in natural sequences, but synthesized in the laboratory and incorporated into RNA. At this stage, the catalog of unnatural modifications includes residues found in experimentally determined RNA structures deposided in the RCSB PDB database. The catalogue of modifications present in MODOMICS is divided into two sub-tables. These can be viewed separately. The user can click one of the two toggling labels (Fig. SM1 BOX 1).
RNA SEQUENCES
We have introduced a toggling system in the RNA sequences section, operating analogously to the modifications section. The three distinct toggling buttons (Fig. SM2 BOX 1) enable the user to visualize the RNA sequence modifications in three different formats: UNICODE characters, short names, and MODOMICS codes. Toggling sub-tables are delineated in red. The UNICODE table has been updated to include new characters representing sequence modifications.
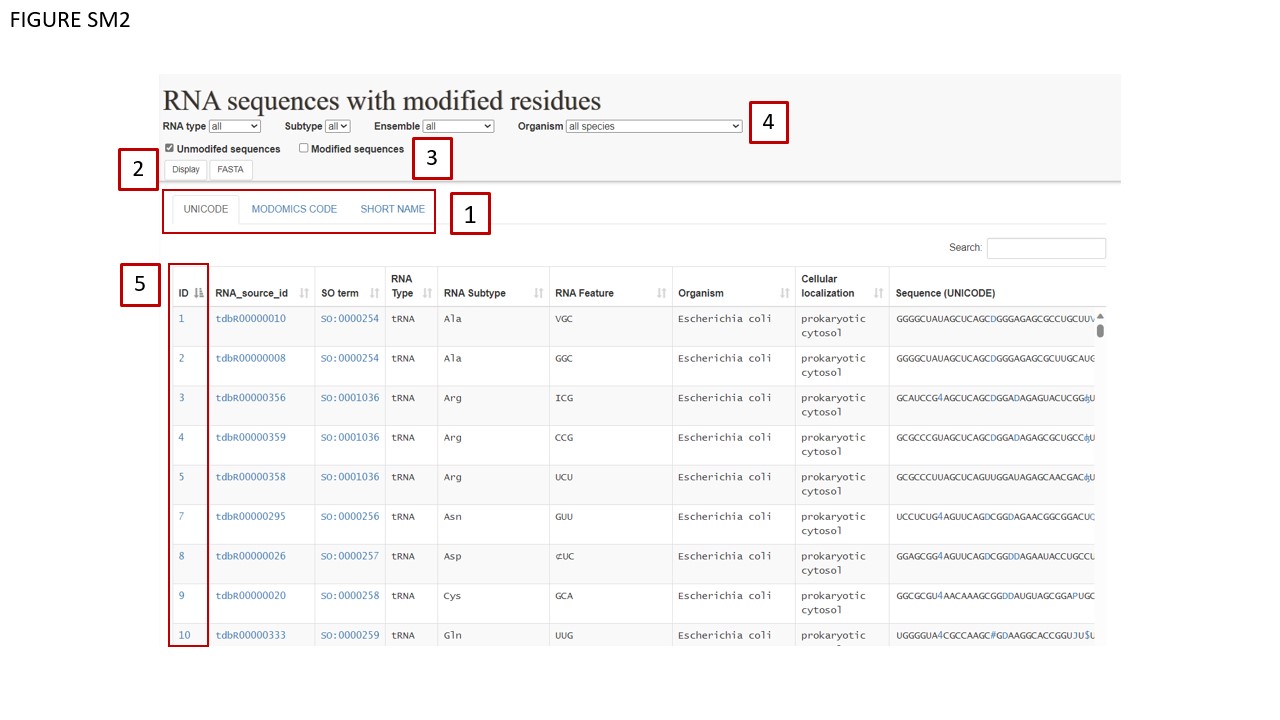
After combining these filters, users must check one of the two available checkboxes (Fig. SM2 BOX 3) selecting whether the sequences should be downloaded with or without modifications. The FASTA button (Fig. SM2 BOX 4) enables direct download in FASTA format, while the DISPLAY button allows users to preview selected sequences.
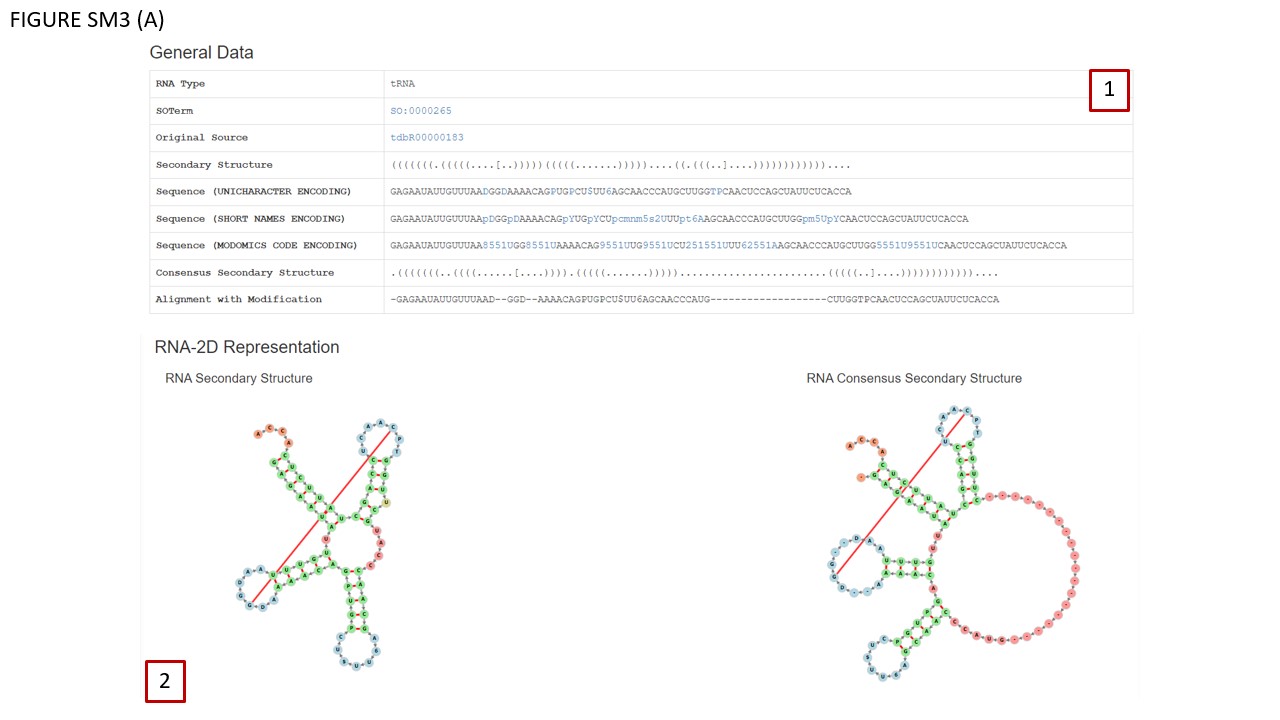
tRNAs have been manually annotated with the patterns of canonical base-pairs, combining the data from the literature and from experimentally determined structures. In BOX 2 (Fig. SM3 (A)) secondary structure diagrams are displayed with Vienna Fornac, for a given sequence (left panel) and also for that sequence in the context of the tRNA alignment, where a consensus secondary structure is shown, and insertions observed in some tRNA family members are indicated as empty red circles (right panel). The visualization of the RNA consensus structure corresponds to the sequence in the “Alignment with Modifications” panel, where gaps are indicated by dashes.
ANNOTATION OF DATA IN MODOMICS
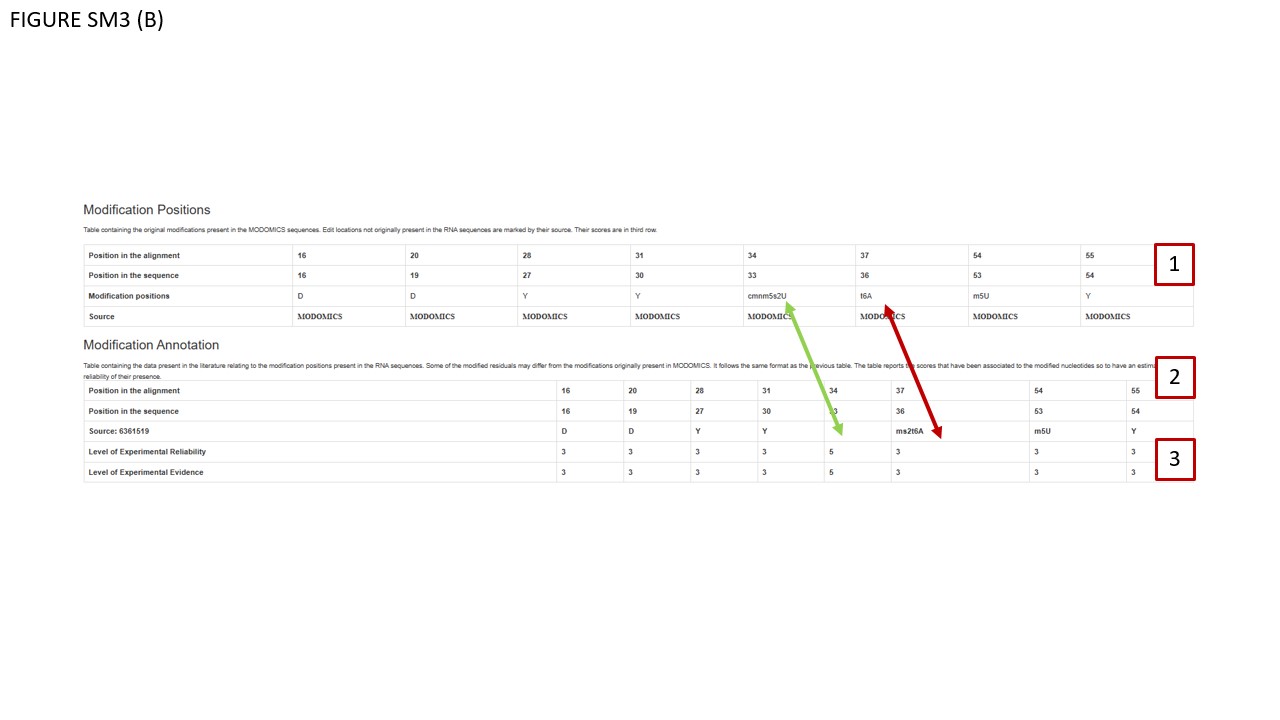
We enhanced the data structure to facilitate more detailed annotations. Specifically, we introduced two annotation features: Evidence indicates the level of experimental or computational support for a given data feature, along with its source (e.g., specific publication, database import, method used, computational prediction, or human inference from metadata). Estimated reliability represents the likelihood of the data's accuracy based on the available evidence. This annotation system applies to all MODOMICS entries, encompassing data obtained experimentally, computationally, or both. Panel “Annotations” describes the classes defined for evidence and estimated reliability, and provides examples of direct/indirect methods used to detect and map modified residues. In Fig SM3 (B), BOX 1 displays the original MODOMICS modifications, while BOX 2 shows the Modification Annotation Table. This table may include modifications, for which conflicting data exist in the literature and/or databases, and in particular the variant in MODOMICS may disagree with one of the external data sources. As indicated by red and green arrows, respectively, positions 36 and 33 may report different modifications not found in published sources. If a modification (at a particular position in a given RNA) in a MODOMICS record has not yet been manually checked, its Evidence as well as Reliability are by default assigned to category 5 (unknown). If a data record in MODOMICS was found to differ from the literature, the Reliability may be assigned to category 4 (questionable). The annotation is work in progress and changes should be expected in the near future, as all positions of modifications are systematically checked and references are added.
RNA ALIGNMENTS
Landing Page
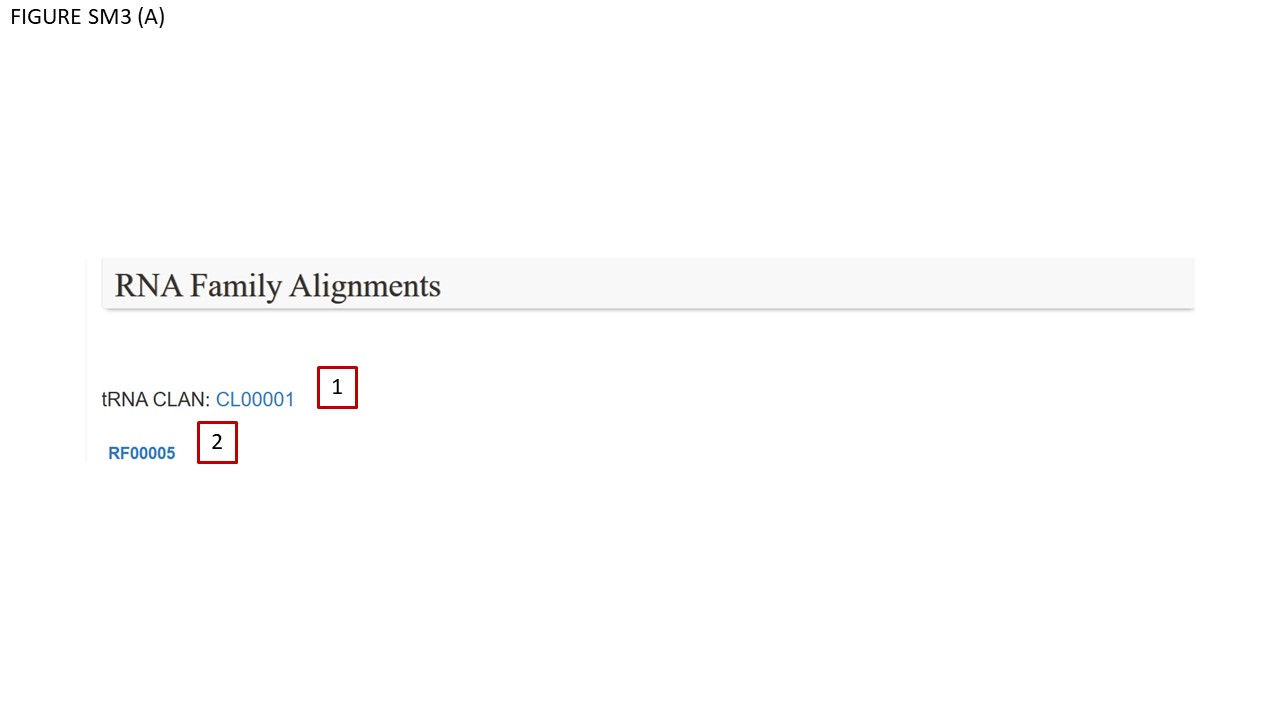
The alignments section is organized in two layers, with the first being an index page. Shown here are the various RNA families present in MODOMICS. Alignments are divided into families. We take tRNAs for example. If existing, links to the CLANs present in RFAM are provided (Fig. SM3 BOX 1). To get to the alignment users must click on the name of the family. For example, click on RF00005 (Fig. SM3 BOX 2) to check tRNA alignments.
Alignment section: tRNA section
For simplicity, we focus on tRNA alignments, which are color-coded to represent distinct functional domains. A corresponding legend is provided at the bottom of the table to elucidate these domains, as reported for both tRNAs and rRNAs (Petrov et al., 2014).
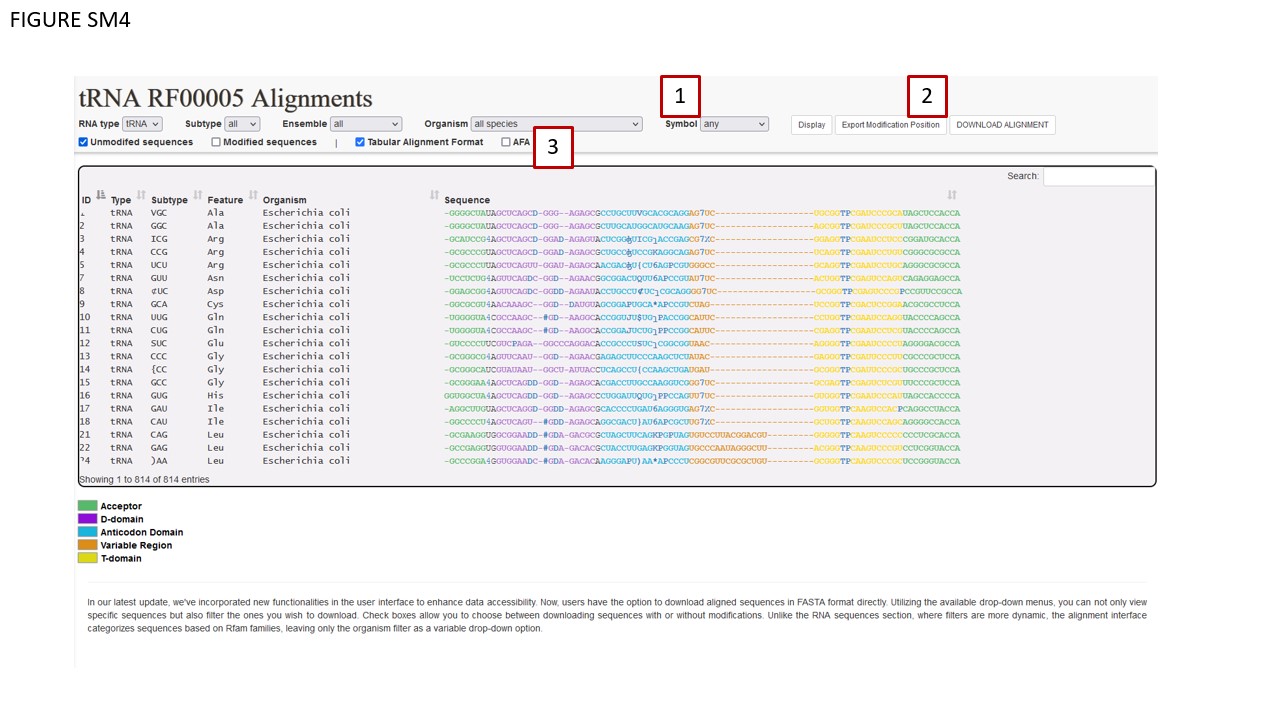
The alignment section’s layout largely mirrors that of the RNA sequence section, save for an additional “Symbol” (Fig. SM4 BOX 1). This drop-down menu filter permits users to download aligned sequences annotated with modifications, using one of the three MODOMICS conventions: UNICODE characters, MODOMICS codes, or short names. Selecting the “Any” option will default to UNICODE characters. Data export functionalities are located on the right-hand section of the interface ribbon (Fig. SM4 BOX 2). Additional check boxes are found at the bottom-left corner of the ribbon (Fig. SM4 BOX 3). The Symbol filter is specifically applicable to the DOWNLOAD ALIGNMENT and EXPORT MODIFICATION POSITION functions, and only when the Tabular Alignment Format checkbox is activated.
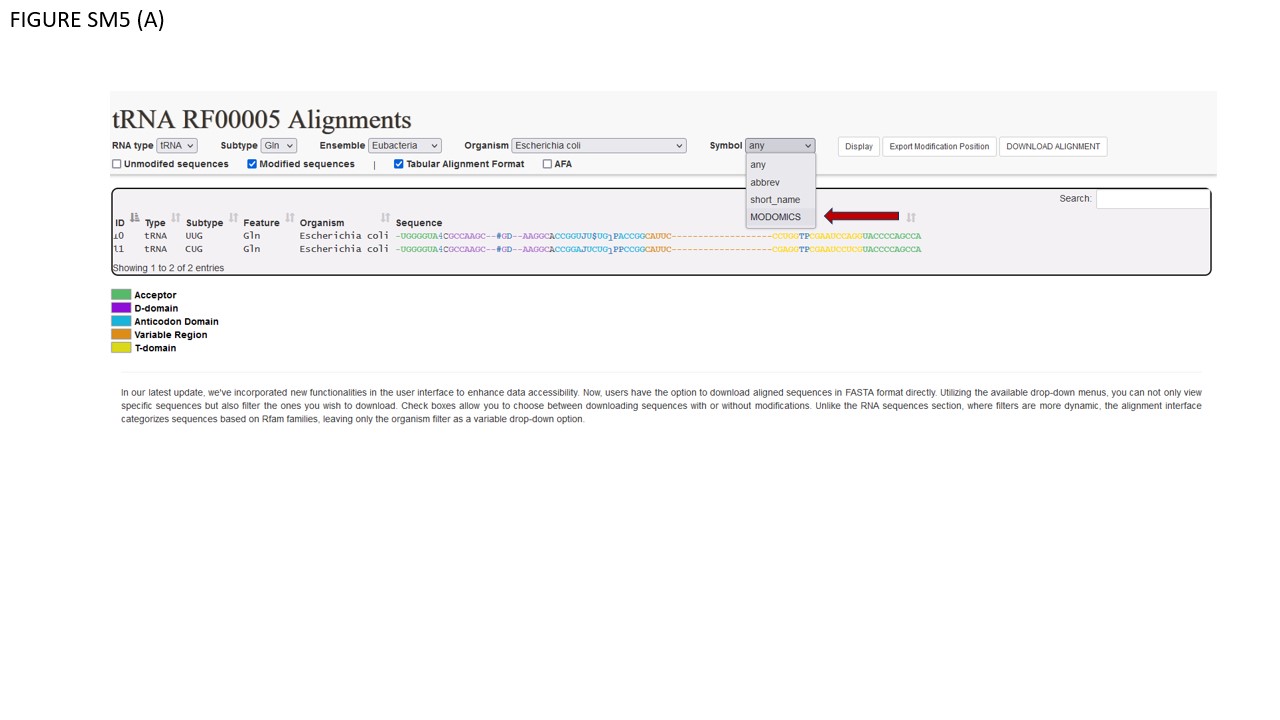
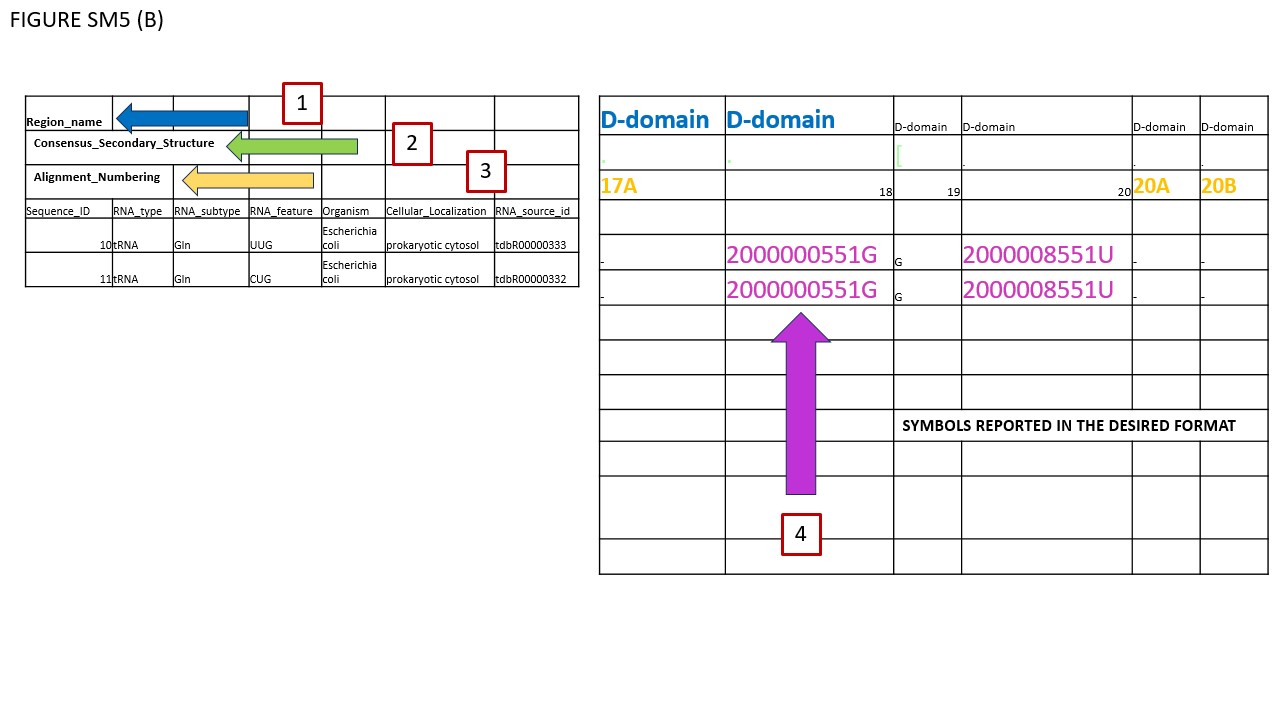
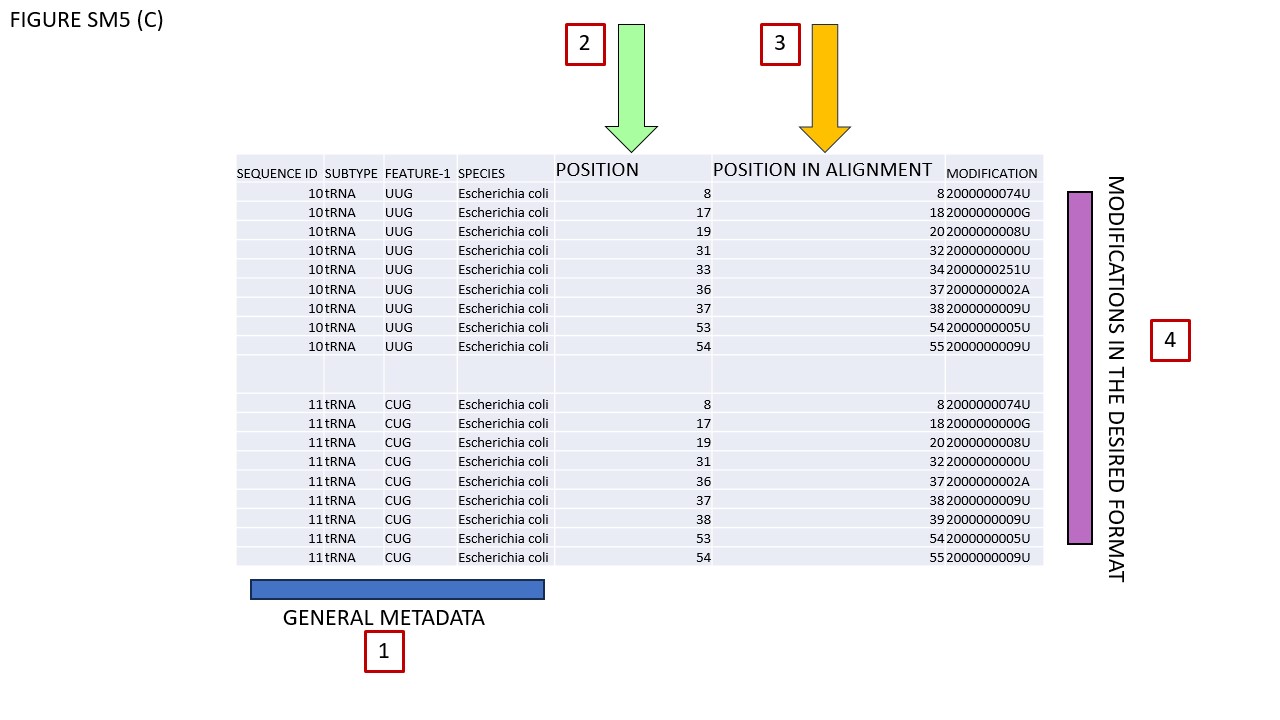
Fig. SM5 illustrates various file types available for download. As an initial step, users should select a small sequence batch for simplicity. For instance, Fig. SM5 (A) shows selected glutamate iso-acceptors from E. coli. Using the Symbol filter, we opted for MODOMICS CODE. Subsequently, we enabled the "Modified sequences" and "Tabular Alignment Format" checkboxes and proceeded to download the alignment. Fig. SM5 (B) reveals the outcome, which is also available in the supplementary files. In BOX 1, the names of functional domains are specified. As illustrated, certain modifications are found within the D-domain. BOX 2's row delineates the consensus secondary structure, while BOX 3's row enumerates the nucleotides, consistently formatted in classical IUPAC notation (A, C, G, U). Given our selection of MODOMICS codes in the Symbol filter, modifications are presented accordingly, as indicated near BOX 4. Conclusively, when the AFA checkbox is activated, aligned sequences can be downloaded in FASTA format. Fig. SM5 (C) portrays the TSV file generated by the EXPORT MODIFICATION POSITION function. This file includes solely the positions of modifications along the chosen sequences. The TSV format comprises seven columns. The first four columns (encapsulated in BOX 1) describe general attributes of the selected sequences: Primary Key, RNA type, RNA subtype, and Subspecies. The fifth column, labeled POSITION (BOX 2), specifies the location of each modification along the sequence. As explicitly stated in its header, "POSITION IN THE ALIGNMENT," indicates the modification's alignment location. The final column denotes the modification itself. Since we opted for MODOMICS codes via the Symbol filter, modifications are annotated using these codes.
PROTEIN SECTION
Landing Page
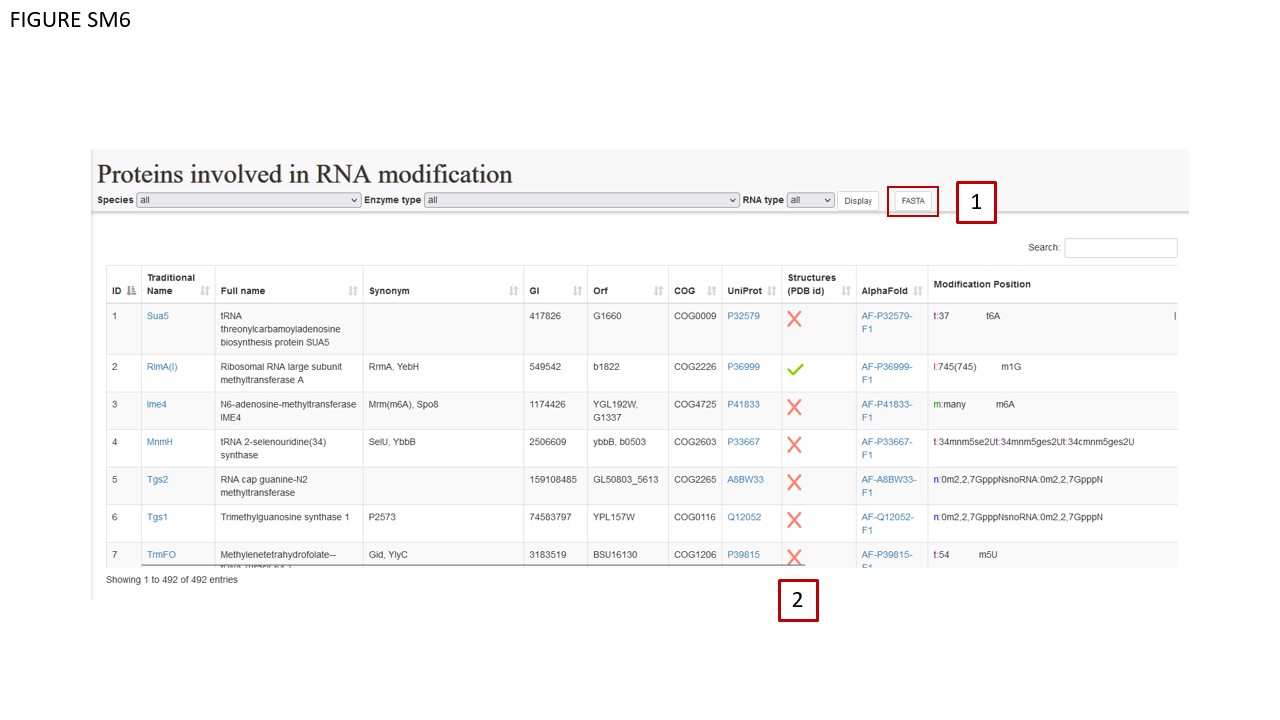
The section dedicated to the modification enzymes has been completely revamped. The landing page remained similar to the preceding version (Fig. SM6). Proteins can be filtered as in the previous MODOMICS release. Such filtering system can be applied to the FASTA user-function (BOX 1), and different batches of protein sequences can be downloaded depending on the applied filter. Positive (green) and negative(red) check symbols (BOX 2) are displayed in the protein-listing table to indicate whether experimentally determined structures are available to be downloaded in the detail page dedicated to a protein.
Protein Detail Page
As in the previous version, MODOMICS provides a dedicated detail page for each protein documented in the database. Recently, we added the visualization of 3D structures, either determined experimentally and available from the RCSB database or predicted computationally (see below). These structures are visualized in three distinct modes: CARTOON, STICK, and LINE, as indicated in Fig. SM7, BOX 1.
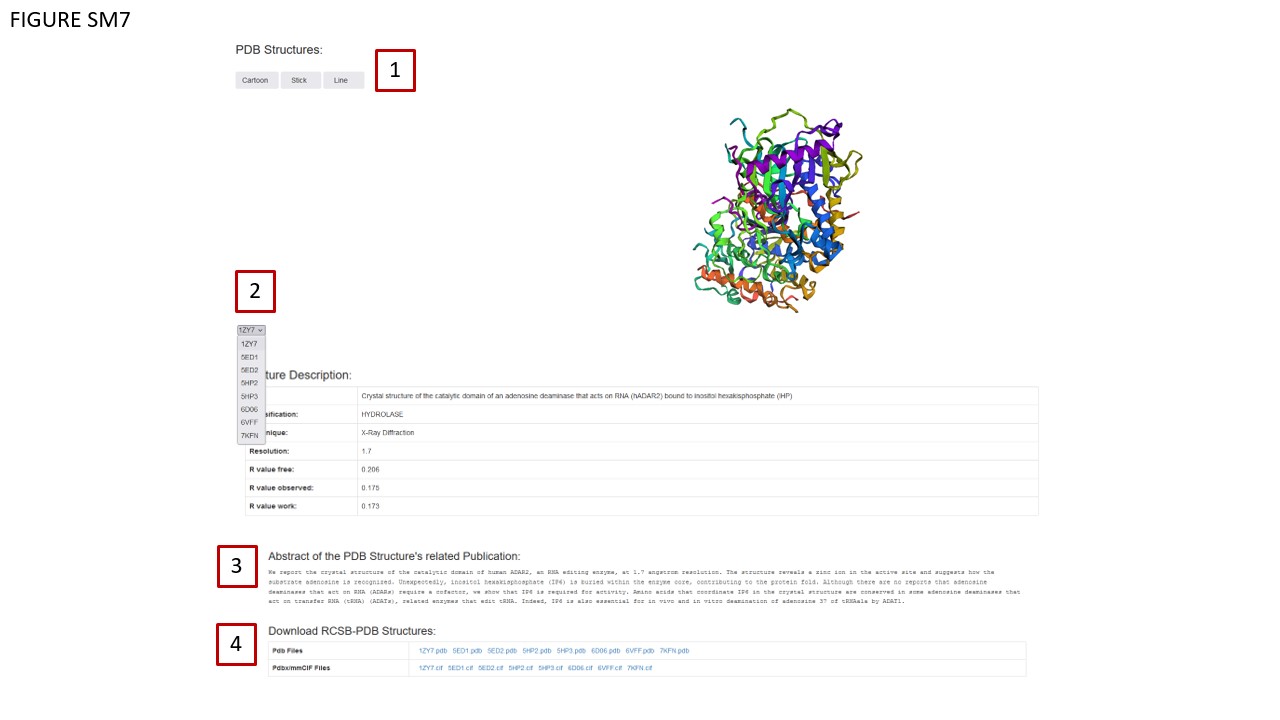
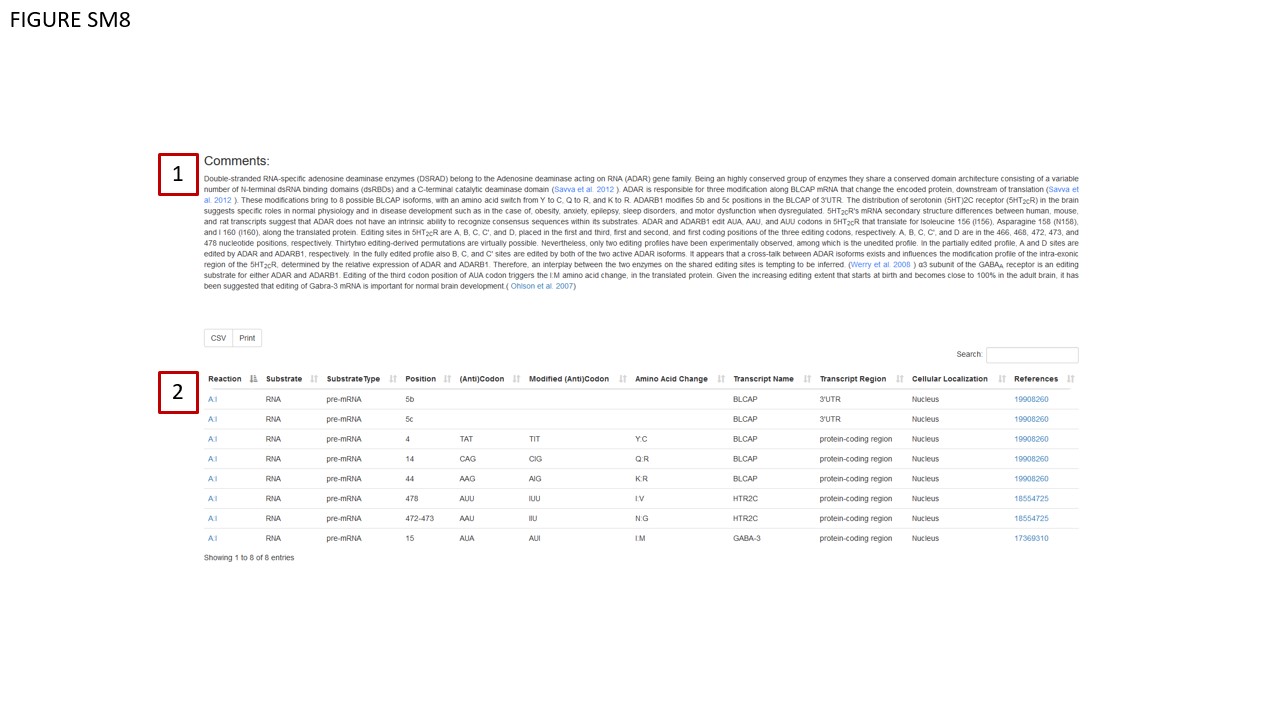
Through a dropdown menu (Fig. SM7, BOX 2), users can dynamically change the structure visualization by selecting a different PDB ID. Associated metadata for these PDB structures is displayed in a table (Fig. SM7, BOX 3), which updates automatically when a new PDB ID is chosen. Moreover, the database annotates the protein's data with the abstract of the publication related to the selected structure (Fig. SM7 BOX 4). Note that the abstract also dynamically changes in correspondence with the selected structure. In instances where the corresponding paper is still under review, this status is explicitly mentioned in the abstract dedicated area. Structural data can be downloaded in either pdb or mmCIF formats, accessible via the table in Fig. SM7, BOX 4. The Comments area (Fig. SM8, BOX 1) contains new information sourced from scientific literature. Enzymatic reactions and known RNA/DNA modification events have been updated and are documented in a dedicated table (Fig. 8, BOX 2).
Taking advantage of recent advancements in protein structure prediction by AlphaFold ( Jumper et al., 2021), our platform utilizes EBI Mol* (Bittrich et al., 2021) to visualize these computationally predicted structures (Fig. SM9, BOX 1). This visualization permits in-depth examination down to individual amino acids.
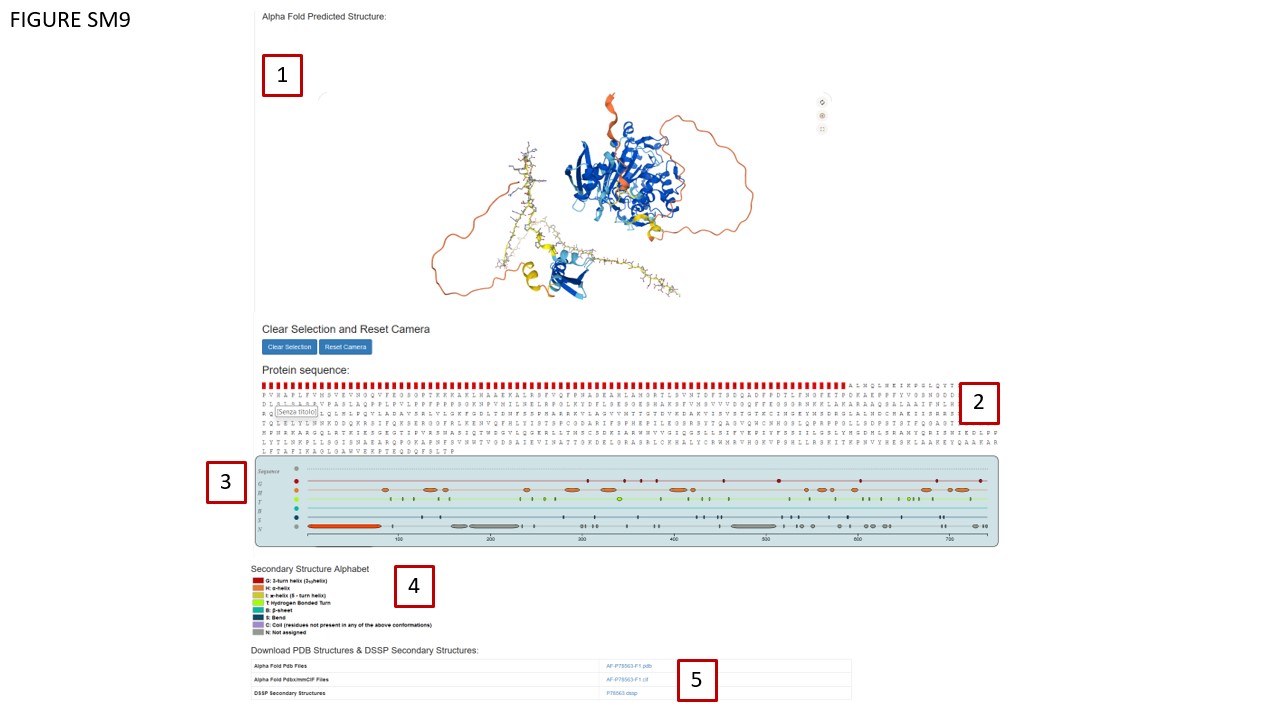
Additionally, we've incorporated an HTML layer for AlphaFold structure exploration (Fig. SM9, BOX 2). Each amino acid is clickable, allowing for zoomed-in viewing on the AlphaFold structure. Hovering over an amino acid highlights it in red. DSSP (Kabsch et al., 1983) has been employed to calculate protein secondary structures, which are visualized using a customized version of the neXtProt Calipho Feature Viewer (Fig. SM9 BOX 3, ( GitHub - calipho-sib/feature-viewer). Protein secondary structures regions can be clicked prompting the Mol* viewer to zoom over the selected region that is highlighted in red in the HTML sequence section, providing the amino acid composition for the selected region. Color code defining protein secondary structures classes is shown in Fig SM9 BOX4. The database also offers downloadable AlphaFold PDB and mmCIF files along with DSSP files, accessible via a table (Fig. SM9, BOX 5).