GDFuzz3D: protein 2D map to 3D structure retrieval service 
Protein contact maps
The contact map of a protein of length L amino acids (aa) is a L x L binary matrix defined as:
           { 1 : d(r(i),r(j)) <= T and |i-j| >= n
cm(i)(j) = {
           { 0 : else

where:
d(*,*) - distance function acting on residue pairs
T - distance threshold (cutoff), typically 8 Angstroms
n - sequence separation parameter, optional (can default to 0)
Residues i and j are in contact iff their residue-specific user-defined distance d doesn't exceed the specified threshold T, and they are separated in the sequence by at least n-1 amino acids.
Typical distance functions used:
CA - distance between the CA atoms
CB - distance between the CB atoms (in case of Gly - CA)
heavy - distance between any heavy (non- hydrogen) atoms
all-atom - distance between any atoms
Protein distance maps
The distance map of a protein of length L aa is a L x L real matrix defined as:
dm(i)(j) =  d(r(i),r(j))

where:
d(*,*) - distance function acting on residue pairs
Residues i and j define a distance map entry which value is real, non-negative distance between them, by using distance function d.
Predicted (fuzzy) protein contact maps
The predicted contact map of a protein of length L aa is a L x L real matrix defined as:
pm(i)(j) =  P( d(r(i),r(j)) <= T )

where:
P(#) - probability of an event #
d(*,*) - distance function acting on residue pairs, typically CA
T - distance threshold (cutoff), typically 8 Angstroms
The residues i and j define a fuzzy contact map entry that estimates the probability p (a real number between 0 and 1) that the residues are in contact. Please note that probability values are method-specific and they tend to vary extensively across various contact prediction methods.
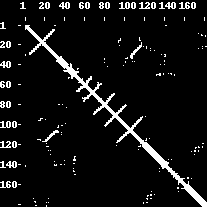
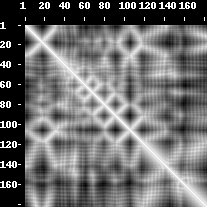
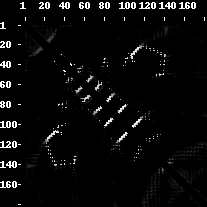
An example of a contact map, distance map and predicted contact map as visualized by the PROTMAP2D program. This is a PDB ID 2LUZ_A structure, 2D de novo prediction was made by MULTICOM group in CASP10. In the contact map picture, the contacts are white dots. In the distance map, the white colour denotes distance values close to zero whilst the darker shades of grey symbolize higher distance values (i.e. 15 Angstroms, 30 Angstroms). Fuzzy contact map has entries with white color symbolizing the probabilities close to one, the grey entries symbolize lower probabilities (i.e. 0.6, 0.4) and black area is a probability zero. The grey color shows a decline in probability or rise of distance values.
Contact: Michal J. Pietal,
Lukasz P. Kozlowski, Janusz M. Bujnicki,
Laboratory of Bioinformatics and Protein Engineering, International Institute of Molecular and Cell Biology in Warsaw